
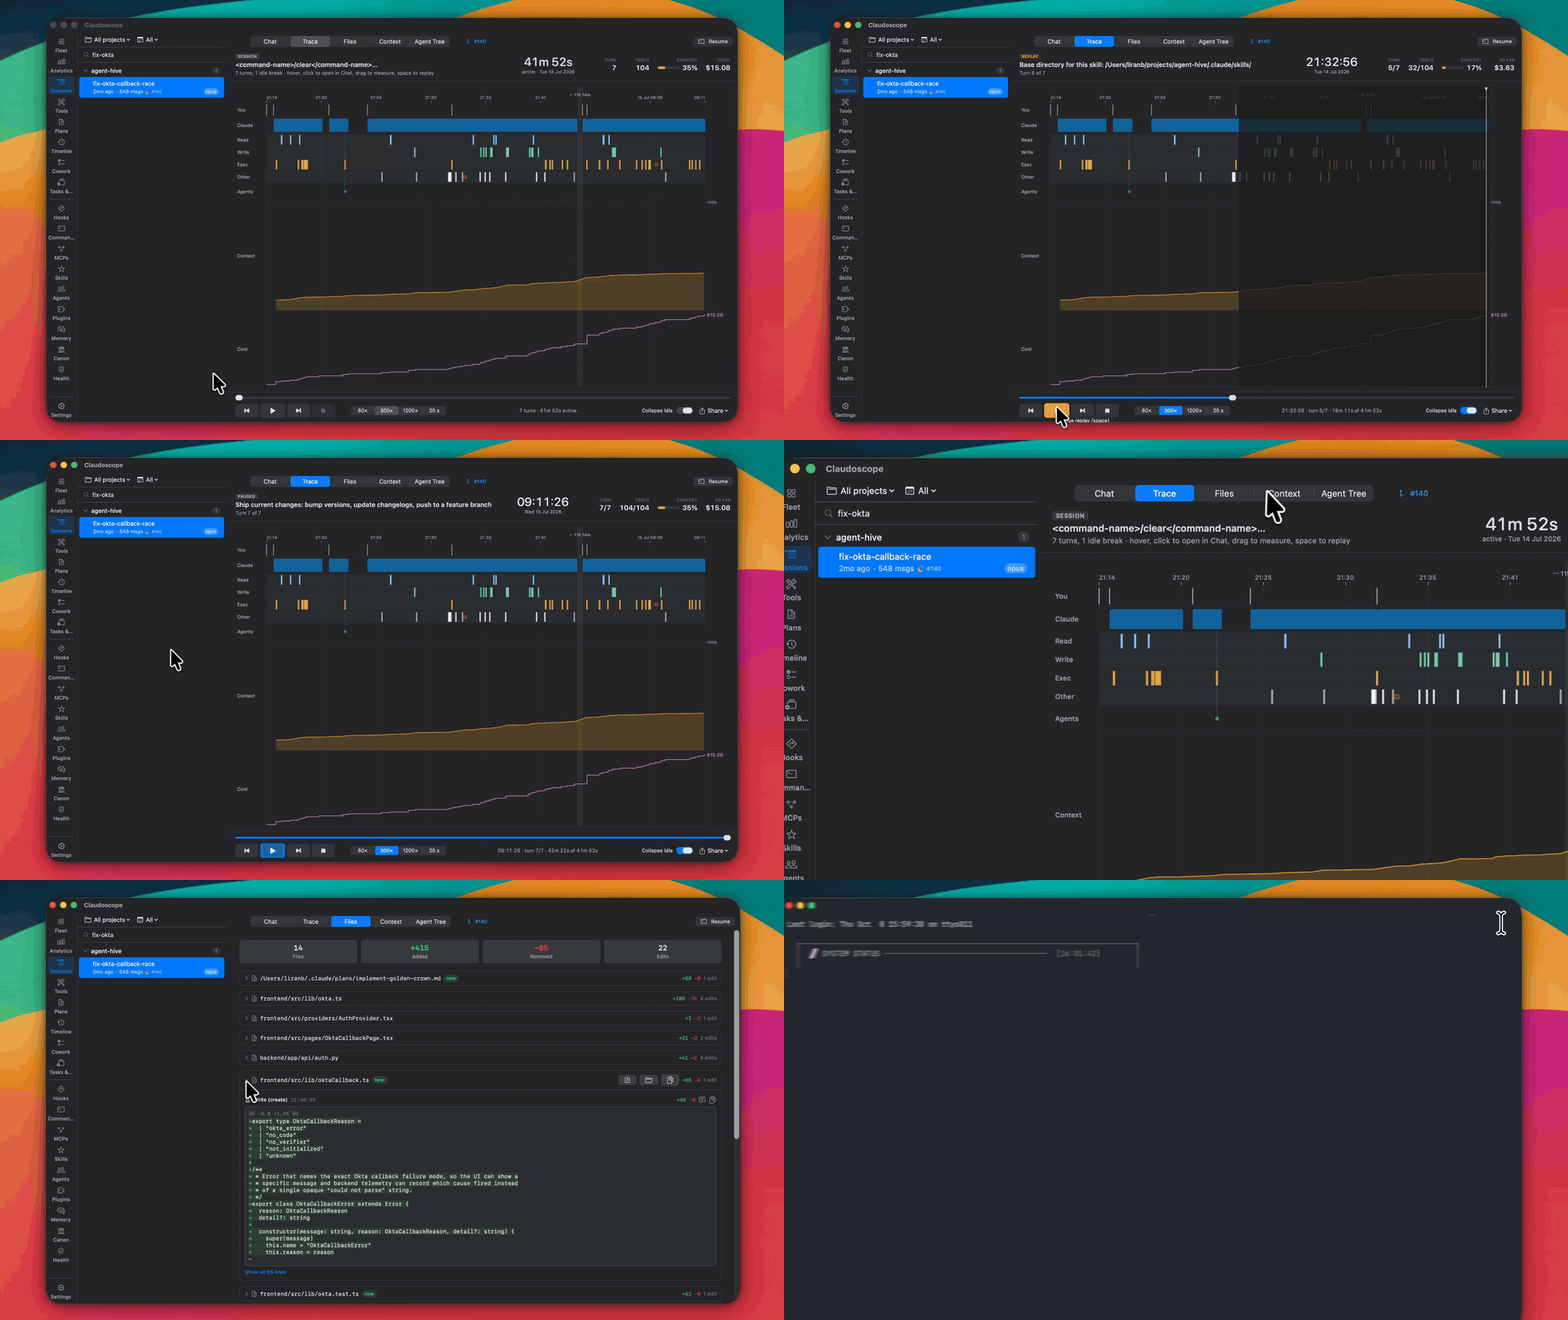
I make Claudoscope, a free, MIT licensed Mac app that reads the session files Claude Code leaves in ~/.claude/projects. Scrolling a long transcript never showed me where a session went wrong, so 1.4 adds a Trace tab. https://raw.githubusercontent.com/cordwainersmith/claudoscope/master/screenshots/trace-view.gif It lays the session out on a time axis: your prompts, tool calls by category, errors and blocked calls, subagents forking off and merging back, context fill with a cut at each compaction, and running cost. Idle stretches over five minutes collapse, so a two day session fits on one screen. Replay (the GIF) plays it back at 60x, 300x or 1200x, or squeezes it into 20 seconds. You can also export a share card PNG with no transcript text in it, and a Resume button reopens the session in Ghostty, iTerm2 or Terminal. 1.3 added Fleet, one board for every session running now or in the last 24 hours. Agents waiting on you go to the top, with a wait timer, the reason, and how long their prompt cache has left. Liveness comes from Claude Code’s own registry in ~/.claude/sessions, not from when a transcript last changed. The board is read only. Claude Code wrote a lot of the Swift here while I steered and reviewed, and profiling its changes is how I found the CPU problem below. The biggest lesson was performance. With sessions streaming and no window open, the app sat at 43% main thread CPU because every append redid work across the whole history. 1.4 gets that under 1%. It runs fully local with no telemetry, on macOS 14+ with Apple Silicon. When a long session goes sideways, what’s the first thing you look at to figure out why? submitted by /u/kenthesaint
Originally posted by u/kenthesaint on r/ClaudeCode